10 min read
Stats
Table of Contents
Overview
The Stats section provides comprehensive statistics for players, teams, and the entire club, plus a player comparison section.
All statistics can be filtered by time range, team, location, opposition, competition, result, and position (where each is applicable).
To do this, tap the filter icon in the header to open the filter sidebar.
Navigation
The Stats section has four main sub-pages accessible via swiping left or right on mobile devices or using the navigation menu on desktop devices:
- Player Stats: Individual player performance metrics
- Team Stats: Team-level statistics and analysis
- Club Stats: Club-wide statistics and analysis
- Comparison: Side-by-side player comparison
Swipe left or right on mobile devices to quickly switch between Stats sub-pages.
You can also access the navigation menu by tapping the burger menu icon in the header (that's the three horizontal lines) to see all available sections and jump directly to any one.
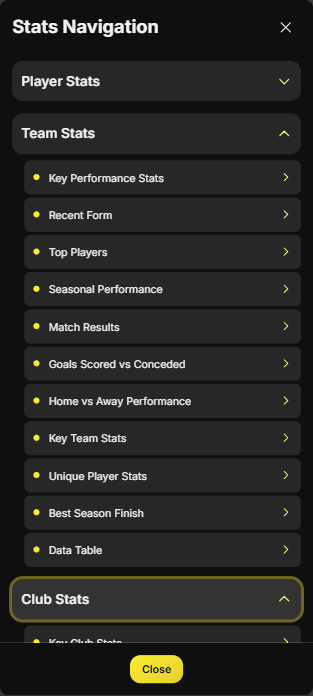
Stats Navigation Menu
The Stats Navigation Menu provides quick access to all sections within the Stats pages.
- Access it by tapping the menu icon (three horizontal lines) in the header when viewing any Stats page.
- Expand the stats page you want to navigate to.
- Tap on any section to jump directly to it.
Use the Stats Navigation Menu to quickly jump to specific sections without scrolling through the entire page.
Filters
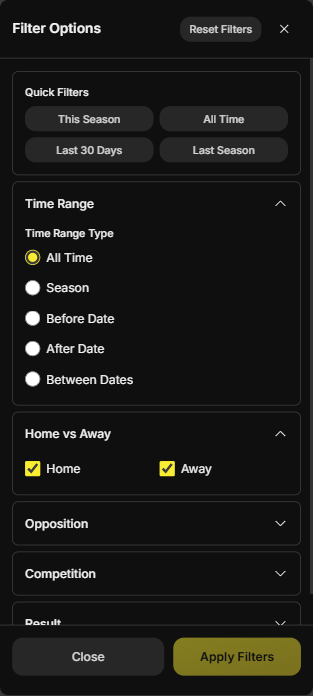
Filters allow you to narrow down statistics to specific criteria. Available filter types include:
- Quick Filters: Filter statistics by quick time periods
- Time Range Filter: Filter statistics by specific seasons or date ranges
- Home vs Away Filter: Filter statistics by home or away matches
- Opposition Filter: Filter statistics by specific opposition teams
- Competition Filter: Filter statistics by specific competitions
- Result Filter: Filter statistics by match results
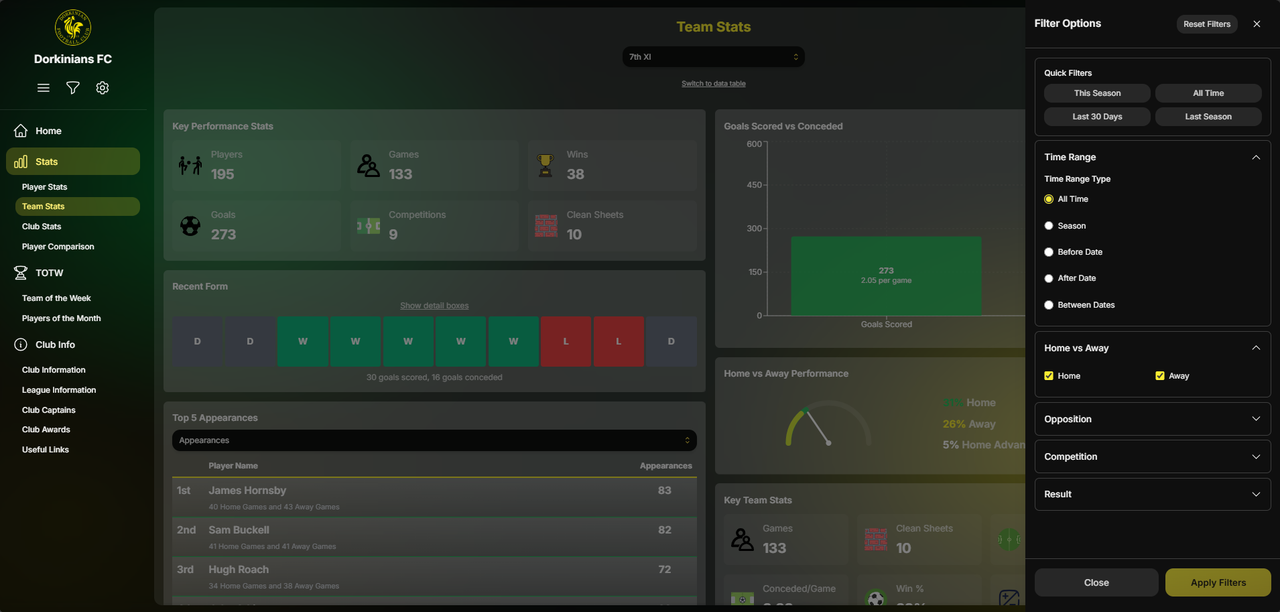
Using Filters:
- Tap the filter icon to open the filter sidebar
- Select your desired filter criteria for each filter type
- Click "Apply Filters" to apply your selections
- Active filters appear as white pills below the header once back on the Stats page so you can see what filters are currently applied
- Tap on a filter pill to quickly remove that specific filter
- Tap "Clear All Filters" in the filter sidebar to remove all active filters
Filter Persistence:
- Filters persist when navigating between Stats sub-pages (Player Stats, Team Stats, Club Stats, Comparison)
- Filters are cleared when you change the selected player or team
Combine multiple filters to create very specific queries. For example, filter by "This Season", "Home", and "Wins" to see how a player performs in home wins this season.
Filters persist when navigating between Stats sub-pages, so remember to clear filters if you want to see unfiltered data in a different section.
Player Stats
The Player Stats section provides comprehensive statistics for individual players. Select a player using the player selector at the top of the page, then explore their performance across multiple categories.
Player Stats Sections
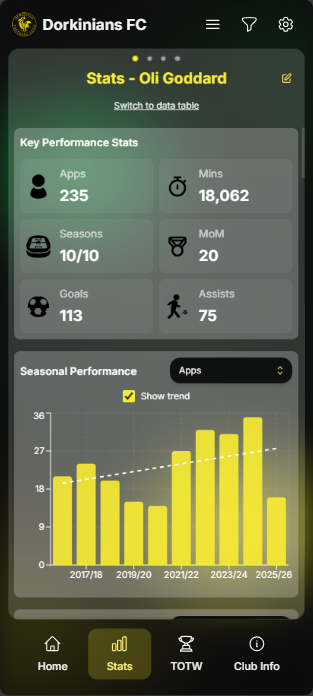
- Key Performance Stats - displays some of the most important metrics for the selected player, including Appearances, Minutes played, Seasons count, Man of the Match awards, Goals scored, and Assists
- All Games - provides a "See All Games" link that opens a full-screen view of all games the player has played in, grouped by season. Expand a season to load and see each game (date, result, competition, home/away). Expand a game to see who played in that game, with position, minutes, goals, assists, and other stats in a table.
- Seasonal Performance - shows how the player's statistics have changed across different seasons displayed in a column chart to show trends over time - with the ability to change which metric is displayed in the chart
- Team Performance - shows how the player performs for different teams within the club displayed in a column chart to show trends over time - with the ability to change which metric is displayed in the chart
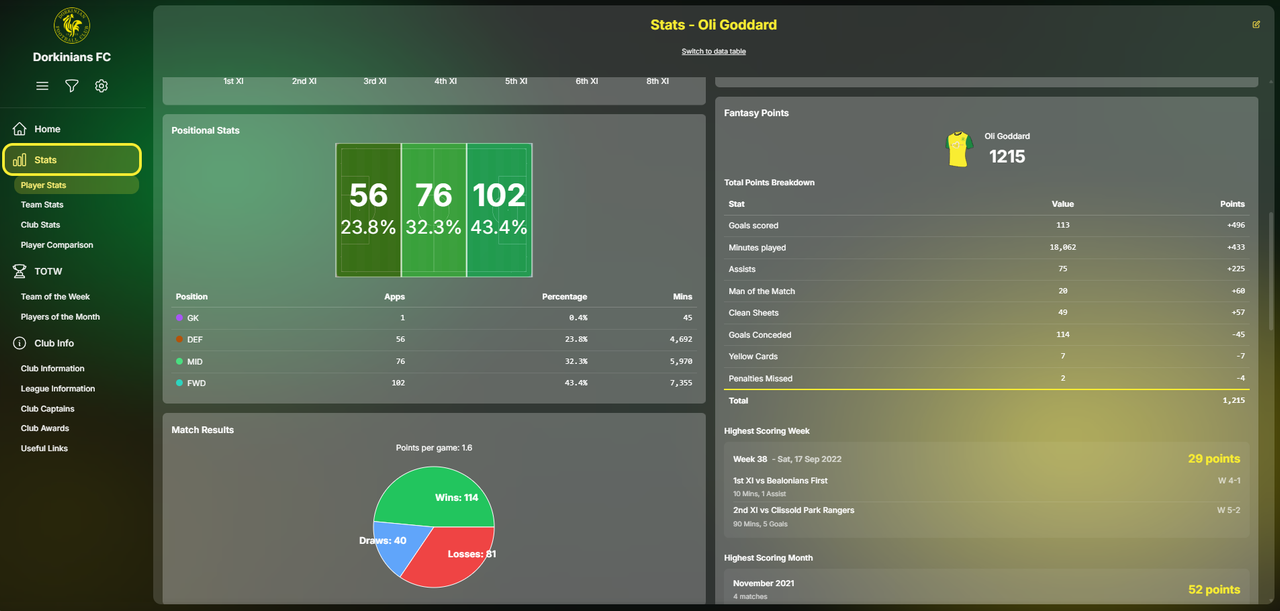
- Positional Stats - displays statistics broken down by the position the player played in (Goalkeeper, Defender, Midfielder, Forward), including appearances and minutes played in each position
Position is determined by the captain's assessment of where the player played the majority of each match.
- Match Results - shows the player's record in matches, such as games won, drawn, and lost, and average points per game
- Game Details - provides a summary of how many games were played in League, Cup, and Friendly matches, how many home and away games the player has played, and some other stats such as how many teammates they have played with
- Monthly Performance - shows statistics broken down by month, helping identify best performing months - with the ability to change which metric is displayed in the chart
- Defensive Record - focuses on defensive statistics, including clean sheets, goals conceded and goals conceded per appearance
If the player selected has ever played as a goalkeeper, the Defensive Record section will also include goalkeeper specific statistics such as saves
- Distance Travelled - shows the total distance round trip the player has travelled to away matches, calculated from the club's home ground (Pixham Sports Ground) to each opposition ground
- Opposition Locations - displays a map showing all the locations where the player has played away matches, providing a visual representation of their travel history
- Opposition Performance - shows how the player performs against different opposition teams, rated by Goals and Assists per appearance against each opposition
- Fantasy Points - displays the player's fantasy football points total and breakdown, as well as the player's highest scoring week and month
Fantasy points are calculated using the standard Premier League fantasy football scoring system - see the Points System section for more details.
- Card Stats - displays the player's yellow and red card statistics and how much it has cost them
- Penalty Stats - displays the player's penalty statistics, including penalties scored, penalties missed, penalties conceded, and penalties saved - in and out of penalty shootouts
- Minutes per Stats - displays efficiency metrics, displaying how many minutes of play are required for various statistics including minutes per goal, minutes per assist and minutes per clean sheet
- Captaincies, Awards and Achievements - displays the player's captaincies, awards and achievements, including Team of the Week appearances, Player of the Month awards, and Milestone achievements
Player Stats Data Table
The Data Table section provides a comprehensive table of all player statistics. To access this, click the "Switch to Data Table" button in the page header.
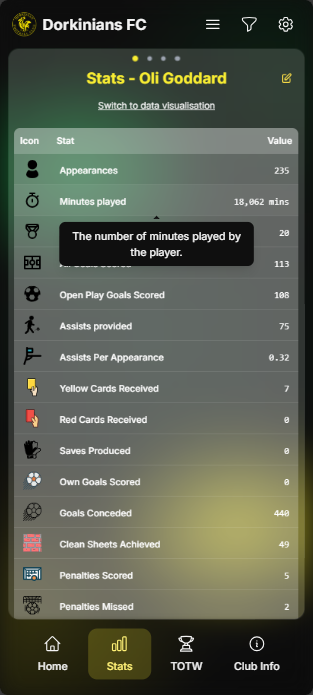
You can click on any stat row in the data table to see a tooltip to help explain the stat.
Team Stats
The Team Stats section provides statistics and analysis for individual teams within the club. Select a team using the team selector, then explore their performance across multiple categories.
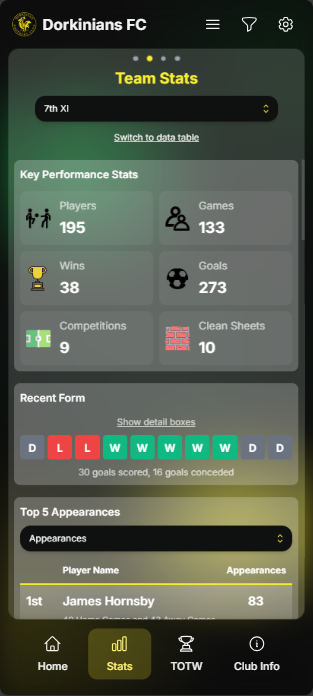
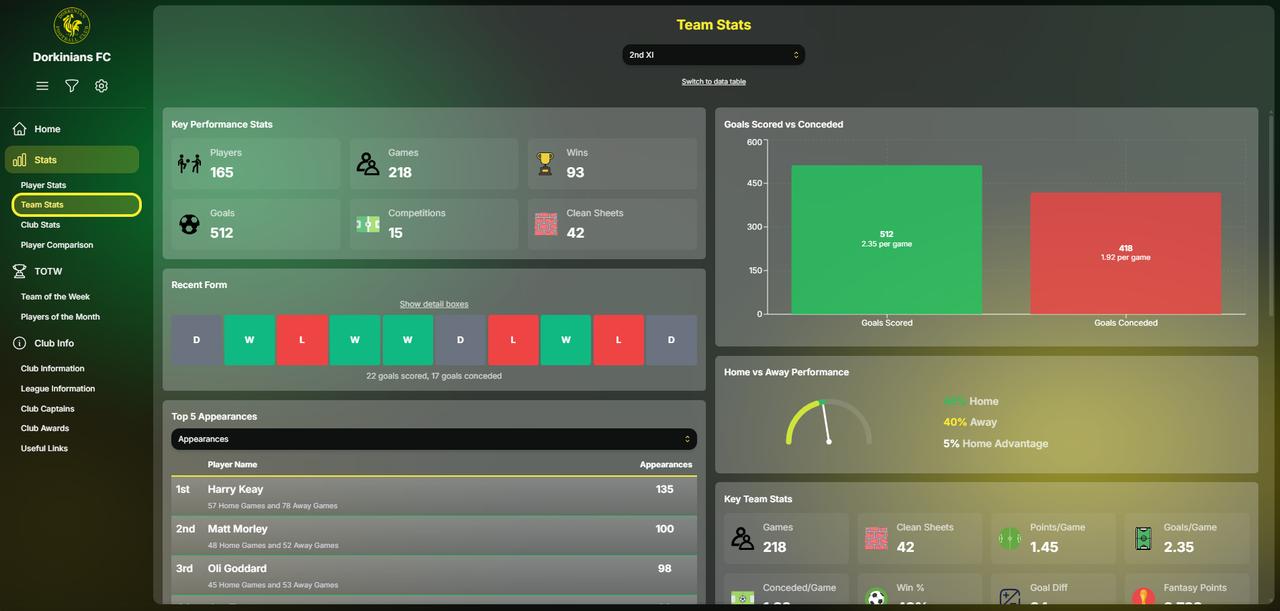
Team Stats Sections
- Key Performance Stats - displays the most important metrics for the selected team, including player count, games, wins and goals
- Recent Form - shows the team's performance in their most recent matches, displaying a form guide (W/D/L indicators) and goals scored and conceded in recent matches
Click on a box to see the details of that fixture or use the "Show detail boxes" to see details such as home and away, league, cup and friendly
- Top Players - displays the best performing players for the selected team across various metrics, including top goal scorers, top assist providers, most appearances, highest fantasy points, and other key statistics
- Seasonal Performance - shows how the team's statistics have changed across different seasons, including games, goals and other key metrics over time
- Match Results - shows the team's record in matches, such as games won, drawn, and lost, and average points per game
- Goals Scored vs Conceded - displays a comparison chart showing the relationship between goals scored and goals conceded, and the average goals scored and conceded per game
- Home vs Away Performance - compares the team's performance at home versus away matches, showing home win percentage vs away win percentage to establish the home advantage gained by the team
- Key Team Stats - displays important team-level statistics, including average points, goals and conceded per game, and other team metrics
- Unique Player Stats - shows statistics about the unique counts of players who have represented the team, including number of unique players, number of unique goals scored, and other unique player-related metrics
- Best Season Finish - displays the team's best league finish across all seasons
Team Stats Data Table
The Data Table section provides a comprehensive table of all player statistics. To access this, click the "Switch to Data Table" button in the page header.
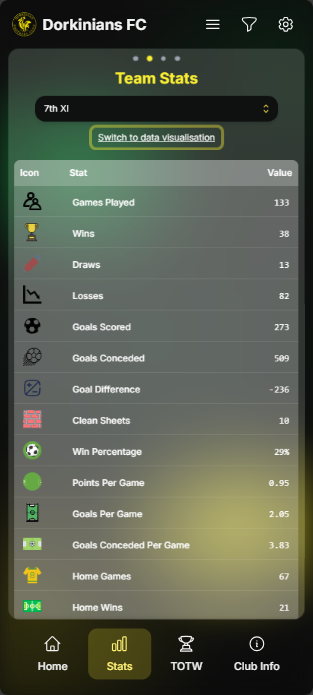
You can click on any stat row in the data table to see a tooltip to help explain the stat.
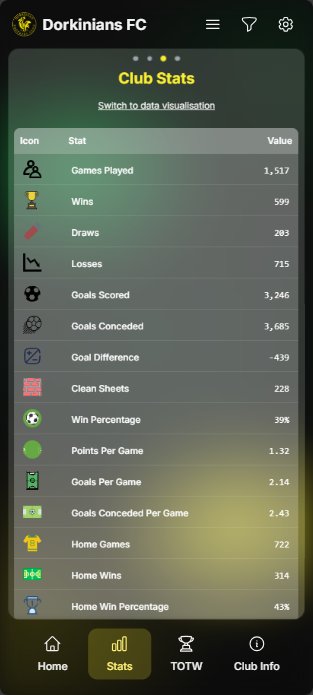
Club Stats
The Club Stats section provides club-wide statistics and comparisons across all teams. This section gives a comprehensive view of the entire club's performance.
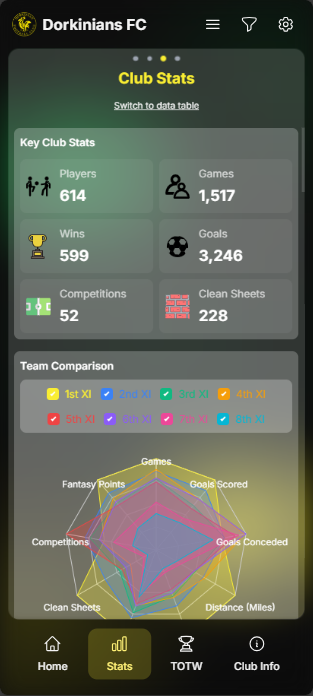
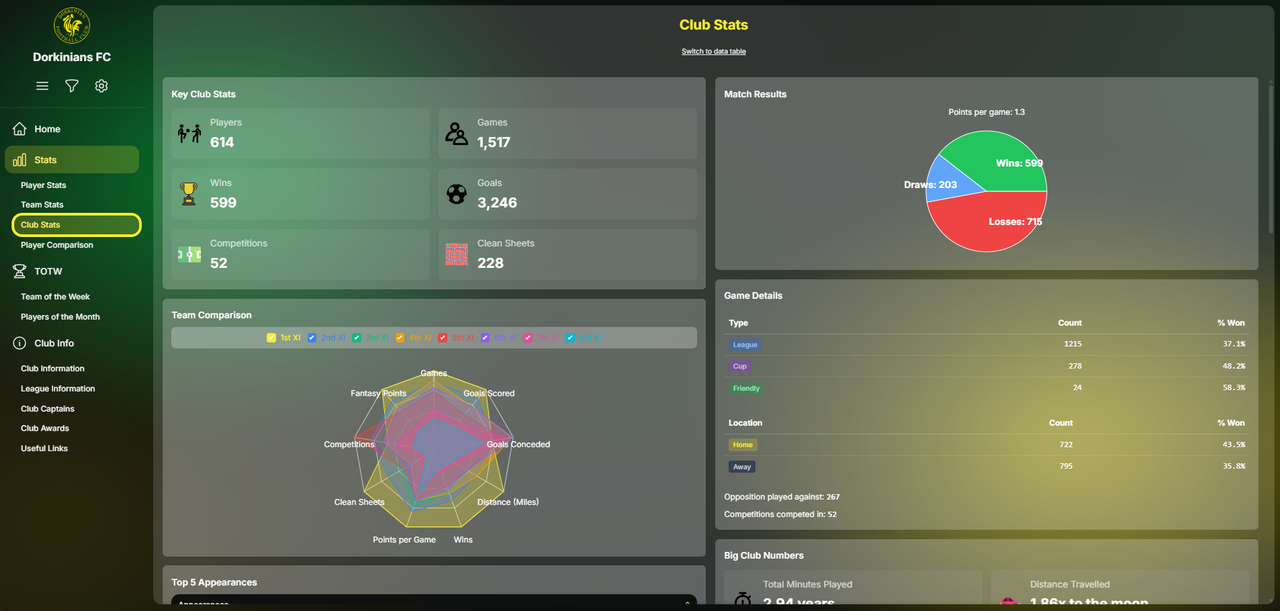
Club Stats Sections
- Key Performance Stats - displays the most important club-wide metrics, including total games played across all teams, total wins, draws, and losses, total goals scored and conceded, overall win percentage and other club-level statistics
- Team Comparison - allows you to compare statistics across different teams within the club, showing an overlaid radar chart across various metrics
- Top Players - displays the best performing players across the entire club, including top goal scorers, top assist providers, most appearances, highest fantasy points, and other club-wide player rankings
- Seasonal Performance - shows how the club's overall statistics have changed across different seasons, displayed in a column chart to show trends over time - with the ability to change which metric is displayed in the chart
- Player Distribution - shows how players are distributed across teams, including the number of players that have represented each team
- Player Tenure - displays statistics about how long players have been with the club, by years of service
- Stats Distribution - shows how various statistics are distributed across the club by position - with the ability to change which metric is displayed in the chart
- Match Results - shows the club's record in matches, such as games won, drawn, and lost, and average points per game
- Game Details - provides a summary of how many games were played in League, Cup, and Friendly matches, how many home and away games the club has played, and some other stats such as how many opposition teams the club has played against
- Big Club Numbers - displays three impressive club-wide records
- Goals Scored vs Conceded - displays a comparison chart showing the relationship between goals scored and goals conceded, and the average goals scored and conceded per game
- Home vs Away Performance - compares the club's performance at home versus away matches, showing home win percentage vs away win percentage to establish the home advantage gained by the club
- Other Club Stats - displays important club-level statistics, including average points, goals and conceded per game, and other club metrics
- Unique Player Stats - shows statistics about the unique counts of players who have represented the club, including number of unique players, number of unique goalscorers and other unique player-related metrics
Club Stats Data Table
The Data Table section provides a comprehensive table of all club statistics. To access this, click the "Switch to Data Table" button in the page header.
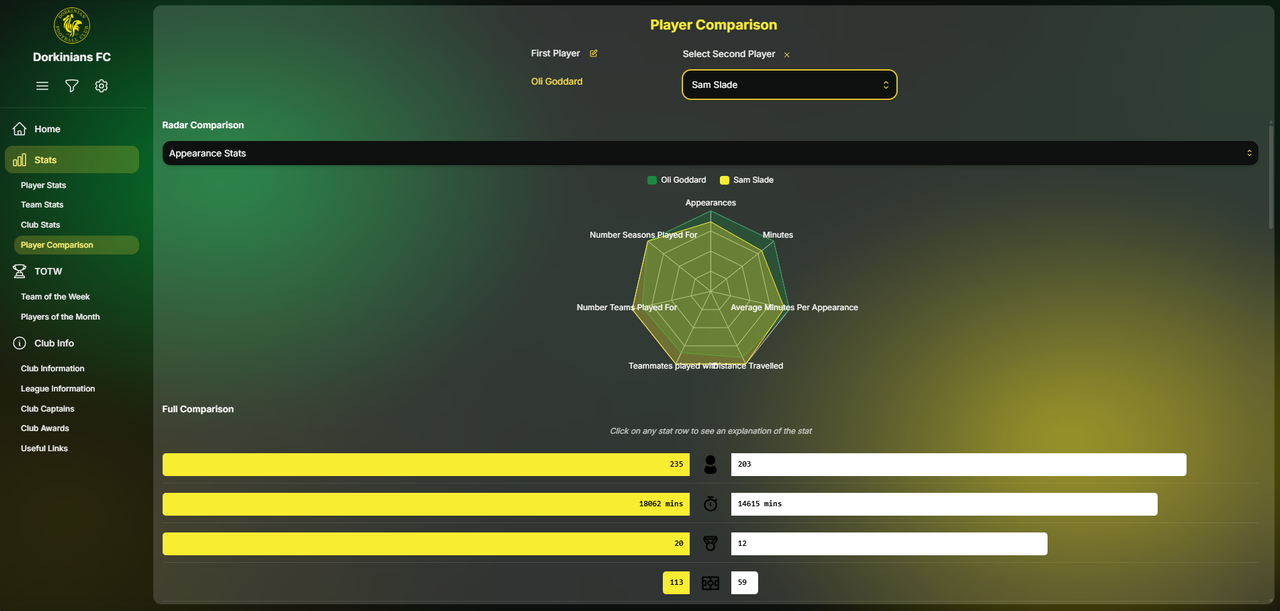
Comparison
The Comparison section allows you to compare multiple players side-by-side using interactive radar charts and detailed statistics.
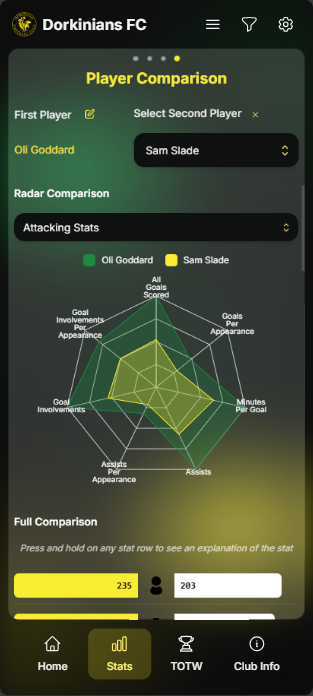
Selecting Players
To compare players:
- The first player is selected from the homepage. It can be changed using the pencil edit icon
- Select the second player by clicking and searching for their name in the player selector
The comparison page still works with filters (see the Filters section for more details).
Radar Charts
A radar chart provides a visual comparison of the two selected players across various statistics. Each axis represents a different statistic, and each player is represented by a different coloured area.
You can change the statistic being displayed in the chart using the dropdown above the chart.
Click or touch on the radar to see a tooltip showing both player's values for that statistic.
Full Comparison
Below the radar chart, you can see a full comparison table of the two players across all statistics. This is useful for seeing how the two players compare across all metrics.
Click on a stat to see a tooltip to help explain the stat.